WE.monitor
Simple. Live. Optimize.
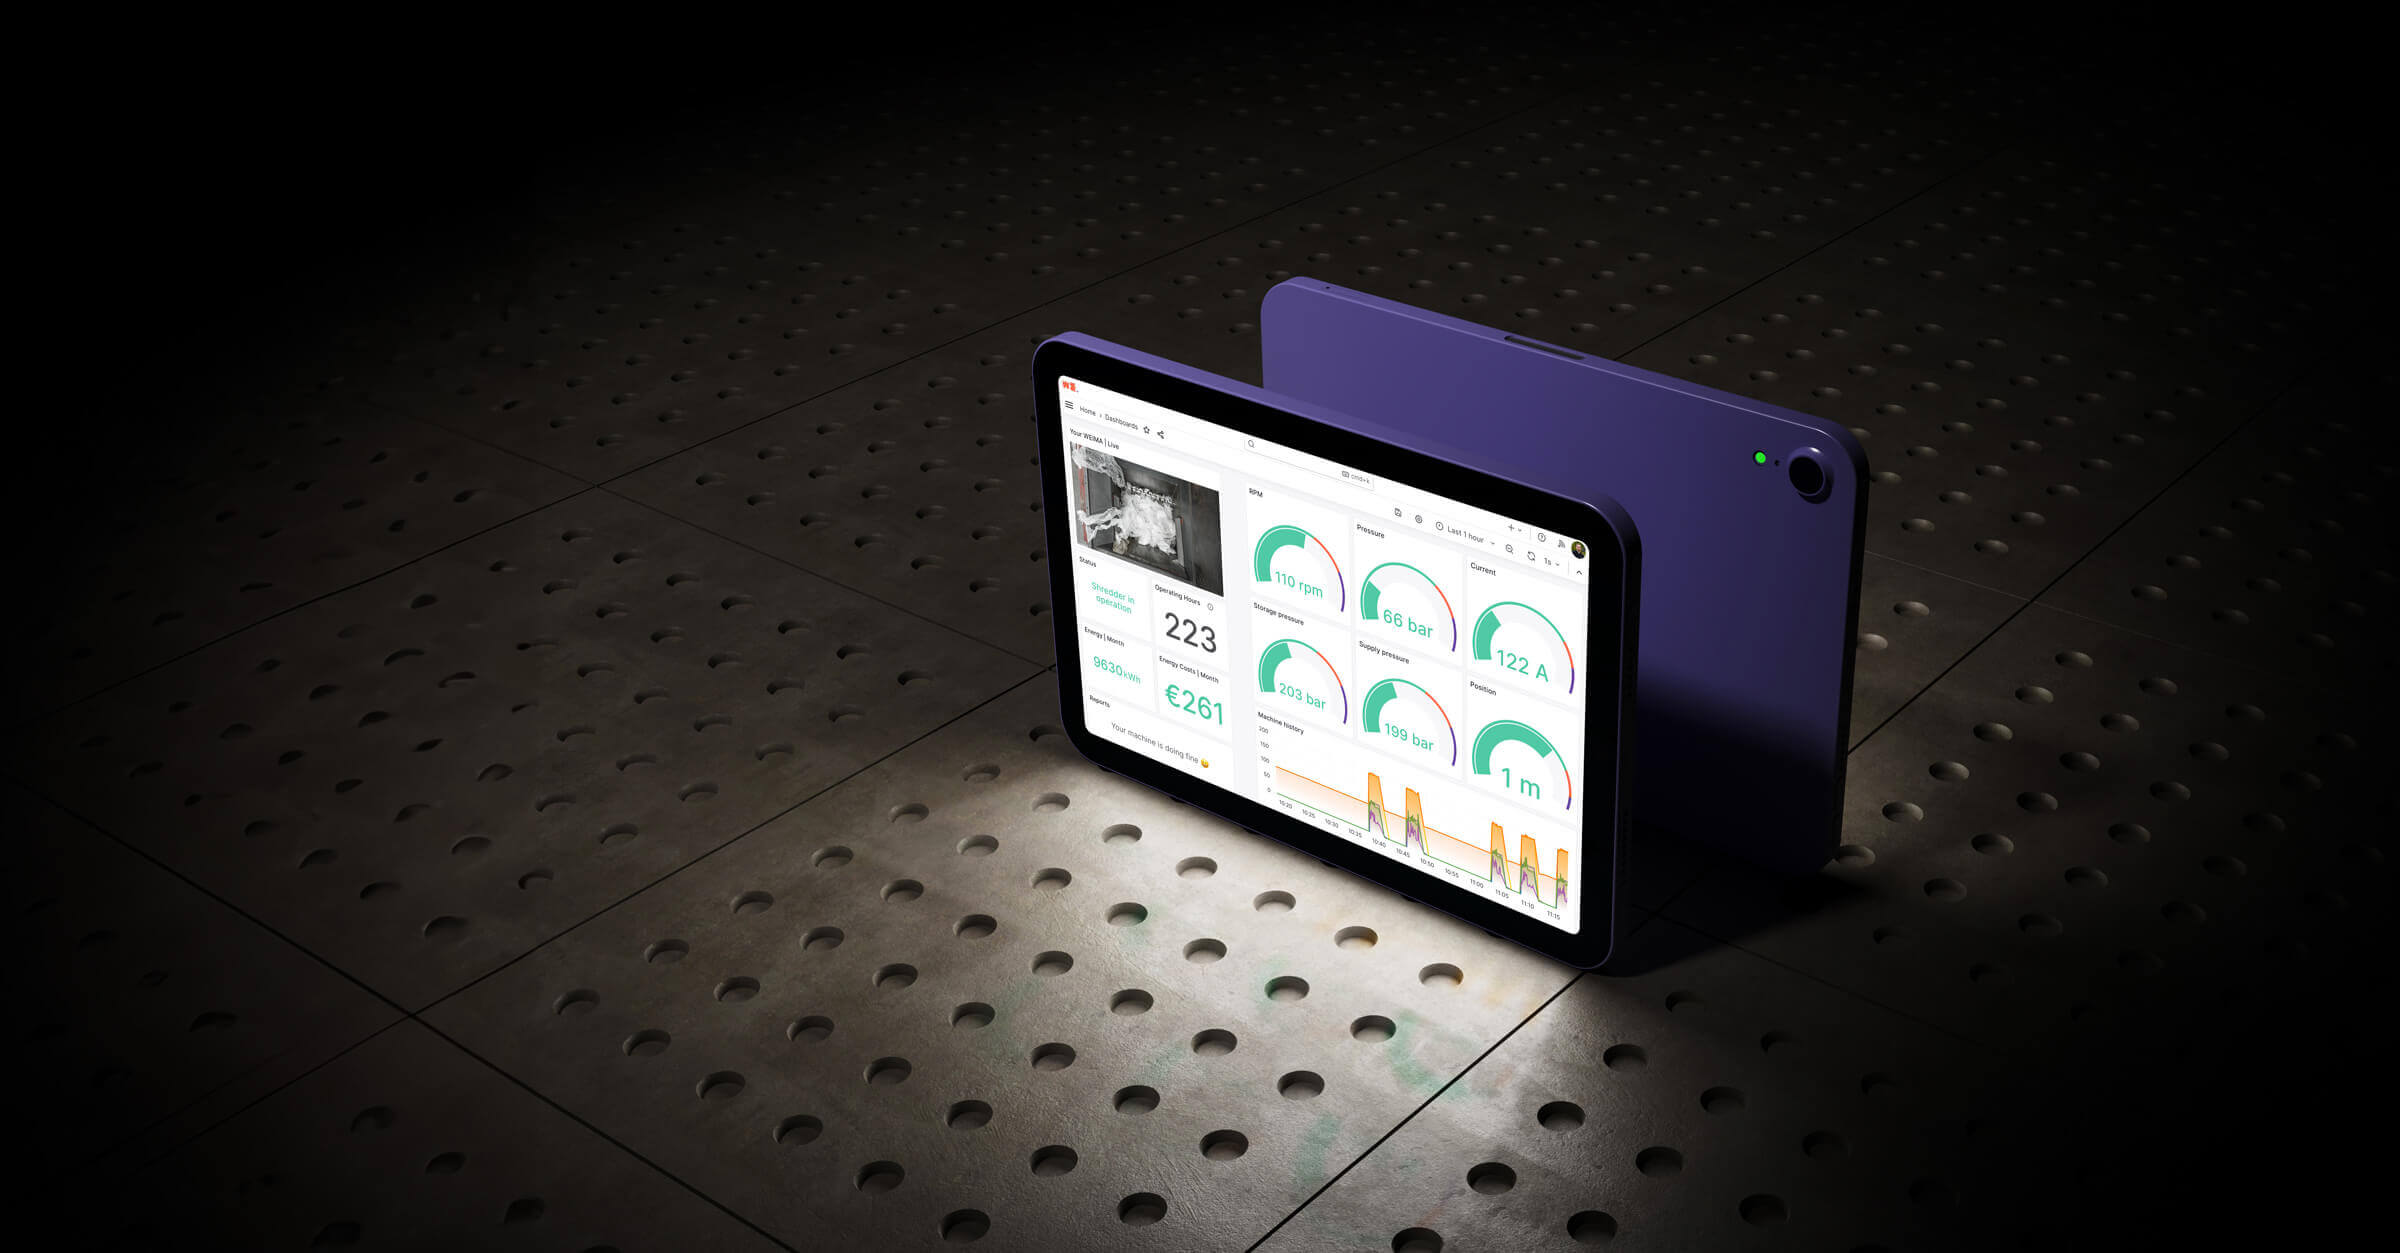
With the new WE.monitor tool from WEIMA, you can now monitor your machine in real time and at any location. The clear dashboard is the gateway to peak production performance. Find out more about the numerous benefits and possible applications here.
Introducing WE.monitor for your WEIMA machine
The Condition Monitoring Dashboard can be used for many WEIMA shredders, briquette presses and dewatering presses.
"The dashboard is used frequently and is really helpful. Thank you for this awesome tool!"
Arne Bohlen | Managing Director at B-Plast 2000 Kunststoffverarbeitungs-GmbH
Focus on real-time data
Get live insights into the performance of your machines. Track every process step and optimize your production for maximum efficiency. The built-in sensors measure pressure, power usage, speed, temperature and positions.

Optimizing energy usage
Our clearly structured dashboard allows you to monitor the energy consumption of your machines and put it in relation to time. Identify efficiency potential and reduce costs by optimizing your energy usage.

Reducing downtimes
Thanks to real-time monitoring and preventive measures, you can significantly minimize downtimes. Increase productivity by accessing up-to-date data and reacting immediately to any challenges that arise.

Request your WE.monitor access now.
Angebot anfordern
Using history to improve service
Use comprehensive machine history and give your service team a clear advantage. With detailed historical data, you can create preventive maintenance plans and maximize the lifespan of your machines.

Early warnings in case of unusual behavior
WE.monitor immediately detects unusual machine behavior and sends you warnings. Prevent breakdowns by reacting proactively to potential problems and keep your production running smoothly.

How does the WE.monitor work?
Take the shredder, for example: a large amount of data is generated during the shredding process, such as the current power, pressure or torque on the rotor. This data is read out by the control system on the machine and packed into data packets that are passed on to the router, which is also located in the control cabinet.
The data packets are forwarded collectively from the router (Node-RED) to our database (Influx) in the cloud (MS Azure). The cloud stores data very reliably and securely. With the right token, they can be easily retrieved from the database. The WE.monitor dashboard then displays them as text or diagrams.

You would also like to use the WE.monitor?
Please provide us with some more information.
